3 LinkedIn Ads reports to check weekly for better account-based marketing performance
Here are 3 LinkedIn ads reports you can track weekly to understand reach, engagement, and clicks, so your ABM strategy improves every week.

Far too many times, we as marketers get tunneled into the campaign metrics or pipeline influence when it comes to LinkedIn Ads.
They're all important, don't get me wrong.
But how do you take a 50,000 feet view into your LinkedIn Ad account? How do you know beforehand if your ads are reaching your target accounts and if they're engaging with your ads?
If you're thinking "Can't you get that data from LinkedIn Ads Campaign Manager?", the answer is yes.
But it can't show me a weekly trend that's split by industry.
That's the question I struggled to answer before I implemented Fibbler.

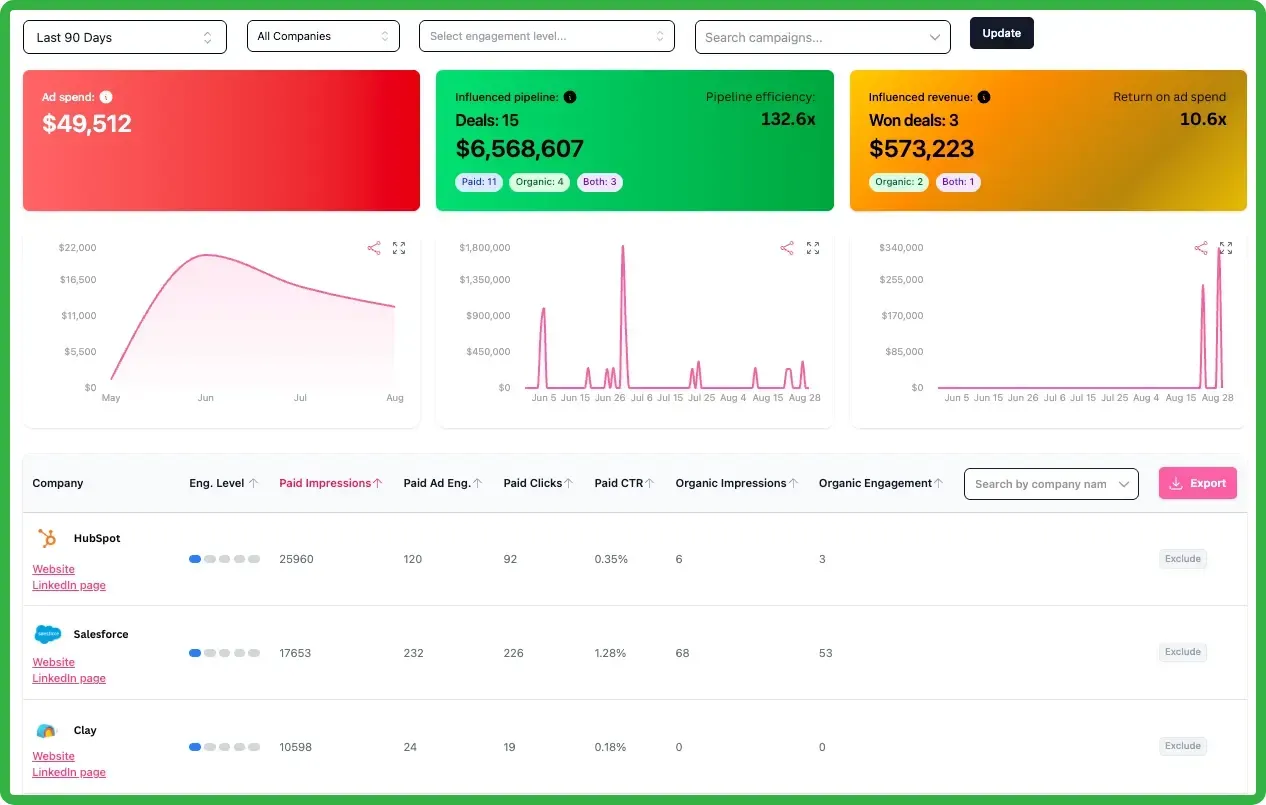
Fibbler - Send LinkedIn Ads data to CRM and prove ROI
See which companies view or interact with your LinkedIn Ads and organic content, tie them to pipeline and revenue in your CRM, and alert sales when it's time to reach out.
Like many of you, I use Fibbler to push these data points from LinkedIn ads to my HubSpot for last 7 days, 30 days, and 90 days:
- Impressions
- Engagement
- Clicks
These data points by themselves were super helpful, but I wanted to watch trends so I can spot patterns and then dive into specific campaigns to make changes, if needed.
Here's how it works.
3 LinkedIn ads reports I track for account level progress
Every Monday morning, I start at the top. I look to understand what has happened in LinkedIn ads at an account level (not at a campaign or ad level).
To get this understanding, I have three charts in HubSpot that's powered by the data that I sync using Fibbler. They tell me, in order:
- Of all the accounts I'm targeting, how many accounts (and who) saw our ads (Reach)
- Of all the accounts that saw our ads, how many (and who) paid attention (Engaged)
- Of the accounts that engaged, how many (and who) took action (Clicked)
It's a simple weekly rhythm that lets me see patterns and problems faster than any Ads Manager dashboard ever could.
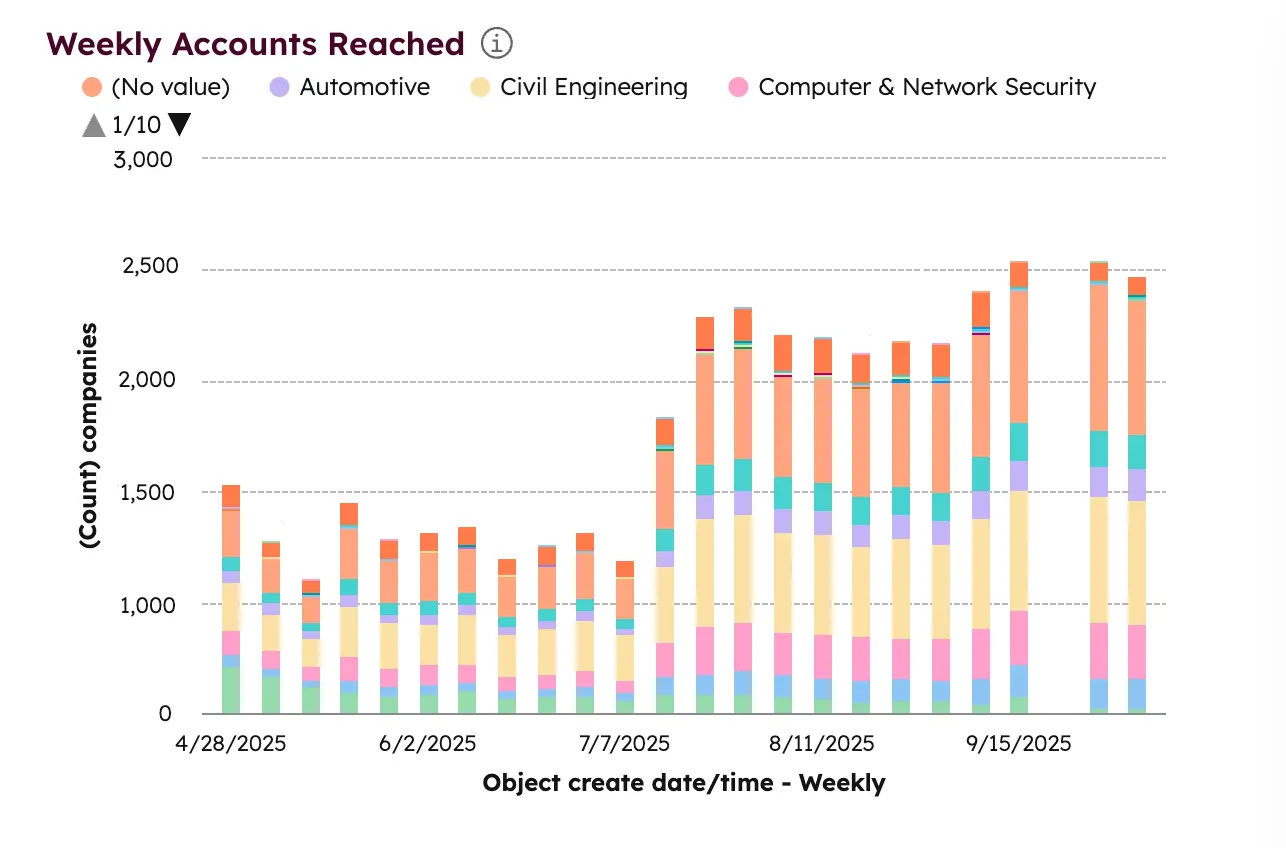
LinkedIn Ads Report 1: Weekly accounts reached: How wide is our net?
This chart tells me how many target accounts saw our ads last week and shows me the week-on-week trend.

It's the awareness ceiling, the total surface area we're covering in our ICP. Here's how I use it to understand my weekly LinkedIn ads performance at an account level:
If reach is climbing, either of these are true:
- We likely increased the budget recently and we're seeing its effects.
- If we didn't increase budgets recently but accounts reached is growing, LinkedIn is showing our ads to new people.
If reach plateaus, either of these are true:
- If the audience penetration is too low, we need to increase the budget
- If we're strapped for budget, we need to add impression capping to force the algorithm to show the ads to new people.
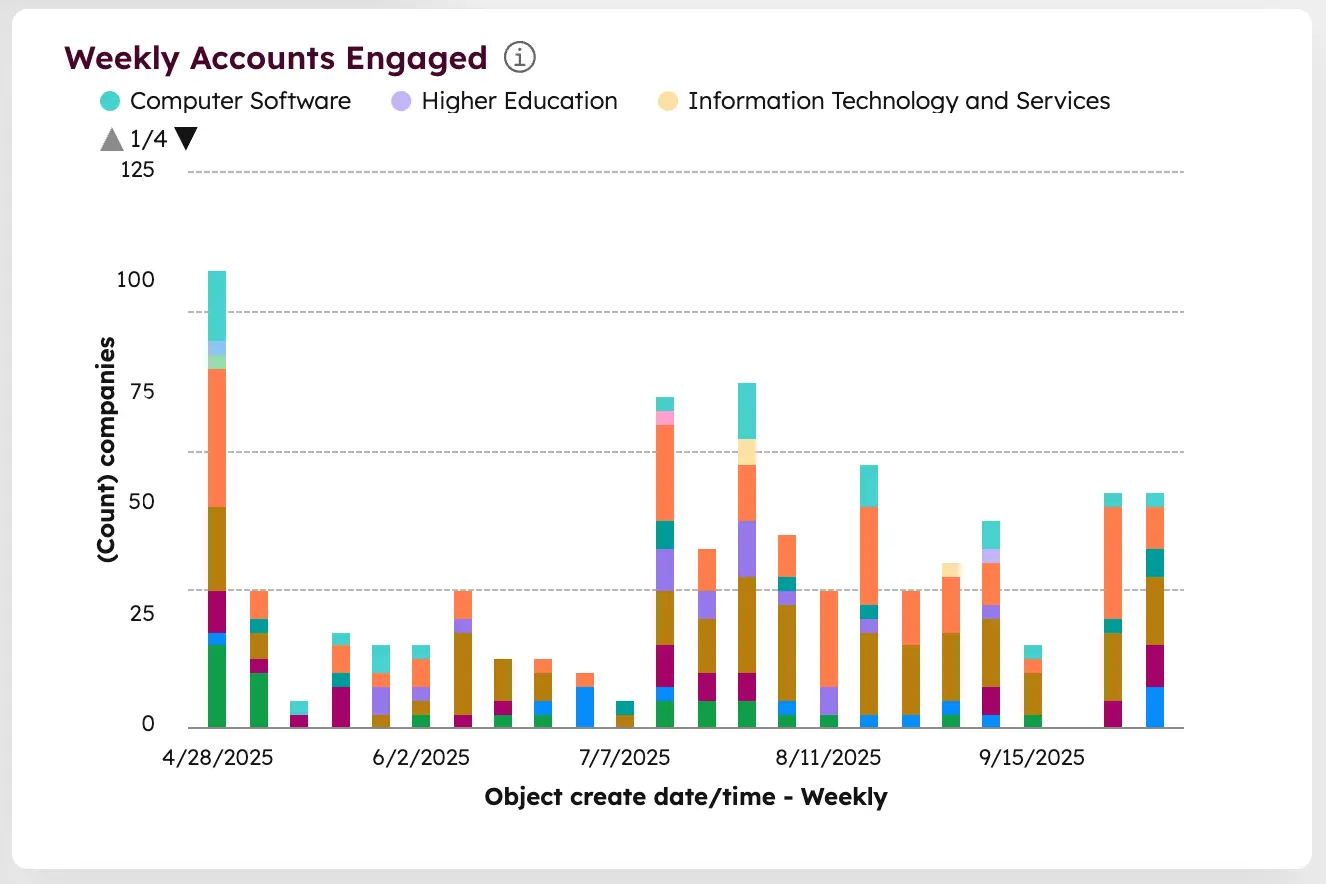
LinkedIn Ads Report 2: Weekly accounts engaged: Does our message land?
Reach tells you how loud you're shouting. Engagement tells you if anyone's actually listening.

At one point, engagement shot up when we launched a storytelling-style video campaign that broke away from the usual "ad tone". The following few weeks showed sustained engagement across multiple industries, which told me the message wasn't just relevant; it was sticky.
Here's how I use that:
- Engagement-to-Reach percentage: If engagement grows faster than reach, the creative's hitting. I aim for 1.5%. Anything above 2 - 2.5% of your entire account list engaging with you week-on-week is incredible.
- Industry Patterns: If certain verticals engage more, that's where I'll dig deeper into that specific segment's campaign to understand what resonated and consider doubling down on that messaging.
- Creative Fatigue: When engagement dips for multiple weeks, I know attention is slipping.
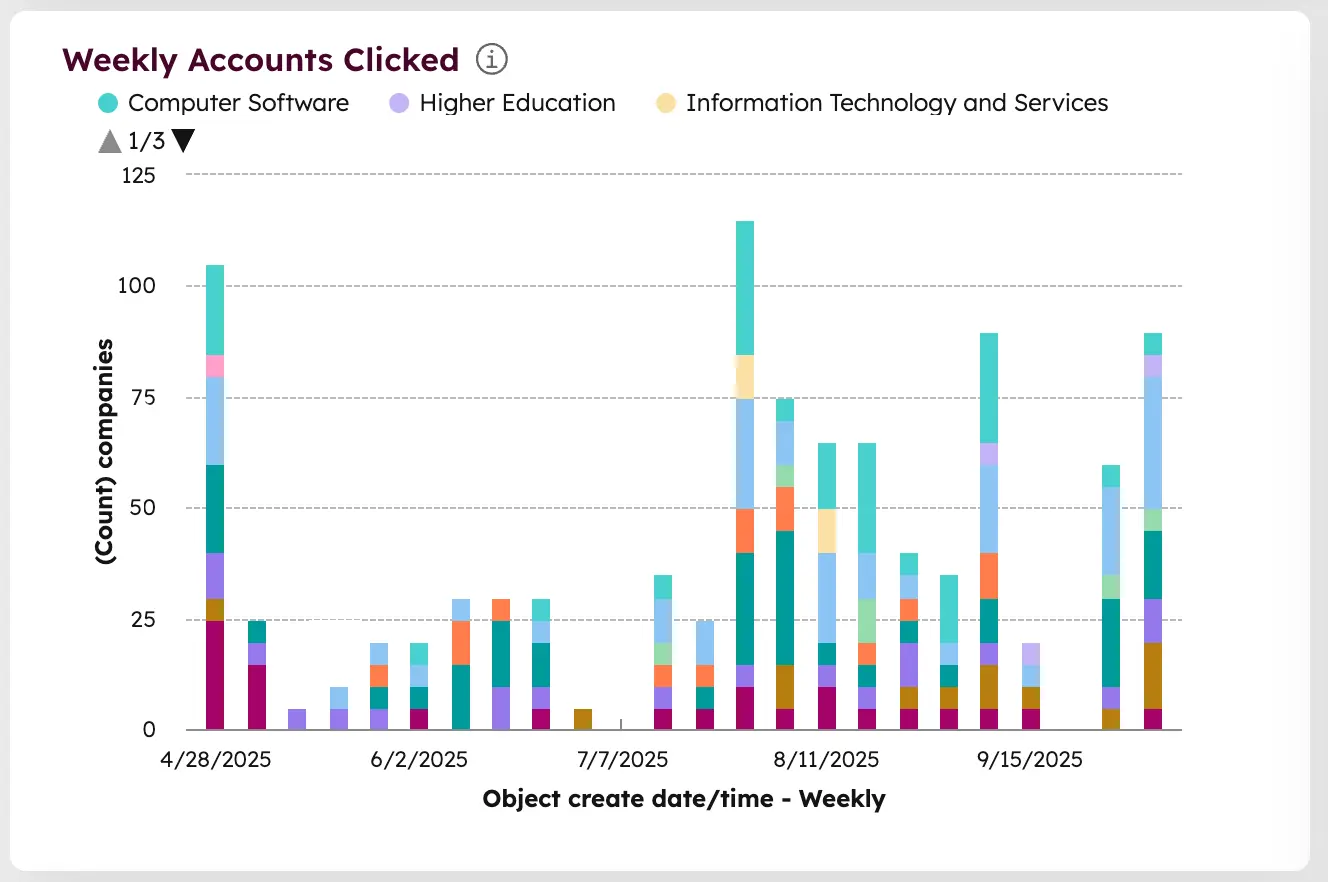
LinkedIn Ads Report 3: Weekly Accounts Clicked: Are we creating enough interest?
Clicks are where curiosity becomes interest.

This chart shows which companies moved from passive awareness to active interest; clicked through to our landing page or filled a form.
So I track a simple metric:
Click-to-Engagement Percentage = How many engaged accounts actually clicked.
I typically aim for at least 70%. It's a perfect signal that our story's not only being heard but acted on.
Anything below that is usually a sign that the ad isn't strong enough to make people want to take the next step. In my experience, this usually means one of the three things:
- Your ads don't have a strong emotional trigger to make them act on it.
- Your CTA doesn't match the ideal next step.
But how to build these LinkedIn Ads reports?
Every week, Fibbler updates the properties with the latest data. But the key piece of the puzzle to build trend reports is storing weekly data inside your CRM in a custom object.
To do that, refer to this guide on how to set it up.
Once your Fibbler data is stored into a custom object in HubSpot, setting up these charts is straightforward.
Here's how I build the “Weekly Accounts Reached” chart (and the same process applies for Engaged and Clicked reports):
- Step 1: Create a Custom Report
Go to Reports → Reports → Create Report → From Scratch. Choose Single Object Report and select the object that stores your synced Fibbler data (usually Companies if you're syncing account-level signals). - Step 2: Configure the Axes
X-axis: Set this to Object create date/time – Weekly. This groups your data by week so you can visualize trends over time.
Y-axis: Set this to (Count) companies. This ensures the bar height reflects how many companies (accounts) met your criteria each week. - Step 3: Break Down by Industry
Under the “Break down by” field, choose Industry. This stacks each bar by industry segment so you can see which verticals are contributing to your reach, engagement, or clicks week over week. - Step 4: Filter for LinkedIn Signals
Signal Type: is any of LinkedIn ad Impression, LinkedIn ad Engagement, or LinkedIn ad Click (depending on the report).
Target Account: is equal to True. This keeps the data focused on your ICP and removes noise from irrelevant companies. - Step 5: Choose the Chart Type
Select Vertical Bar Chart. Enable Stacked bars if you want to visualize multiple industries within the same bar. Optionally, toggle Display value labels to show totals above each bar. - Step 6: Save and Add to Dashboard
Give the report a clear name like Weekly Accounts Reached (by Industry). Save it to your LinkedIn Ads dashboard or create a new dashboard for weekly performance tracking.
You'll now have a living chart that updates automatically every week, showing how many target accounts saw, engaged with, or clicked your ads, all sliced by industry.
It's the simplest way to turn raw LinkedIn ads signals into a visual feedback loop that actually helps you make better creative and budget decisions.
Closing reflections: Turning data into direction
As a marketer you're swimming in dashboards, reports, and metrics, but none of it tells you what's actually changing in the market you're trying to reach. It's one of the biggest mistakes many of us make with LinkedIn ads.
When you zoom out and start looking at account-level movement, you start seeing how awareness turns into intent over time. You begin to understand why your campaigns behave the way they do, not just how well they did.
- You can tell when your message is starting to lose attention.
- You can spot when your audience has been fully saturated.
- You can see which verticals are quietly warming up before they ever show up in your CRM.
And once you can read those signals, you begin to steer before the lagging indicators ever catch up.
This article was originally published on Fibbler

